Navigating Chance: The Mathematics of Predictable Uncertainty
Few mathematical disciplines are as counterintuitive to the human brain as probability and statistics. We live in a world governed by random events, yet our brains are wired to see illusory patterns, succumb to the gambler's fallacy (believing that after five coin flips landing on heads, tails is "due"), and struggle with exponential permutations. When probability is taught purely through abstract fraction formulas ($P = \frac{\text{favorable}}{\text{total}}$), students often calculate answers mechanically without grasping the underlying reality.
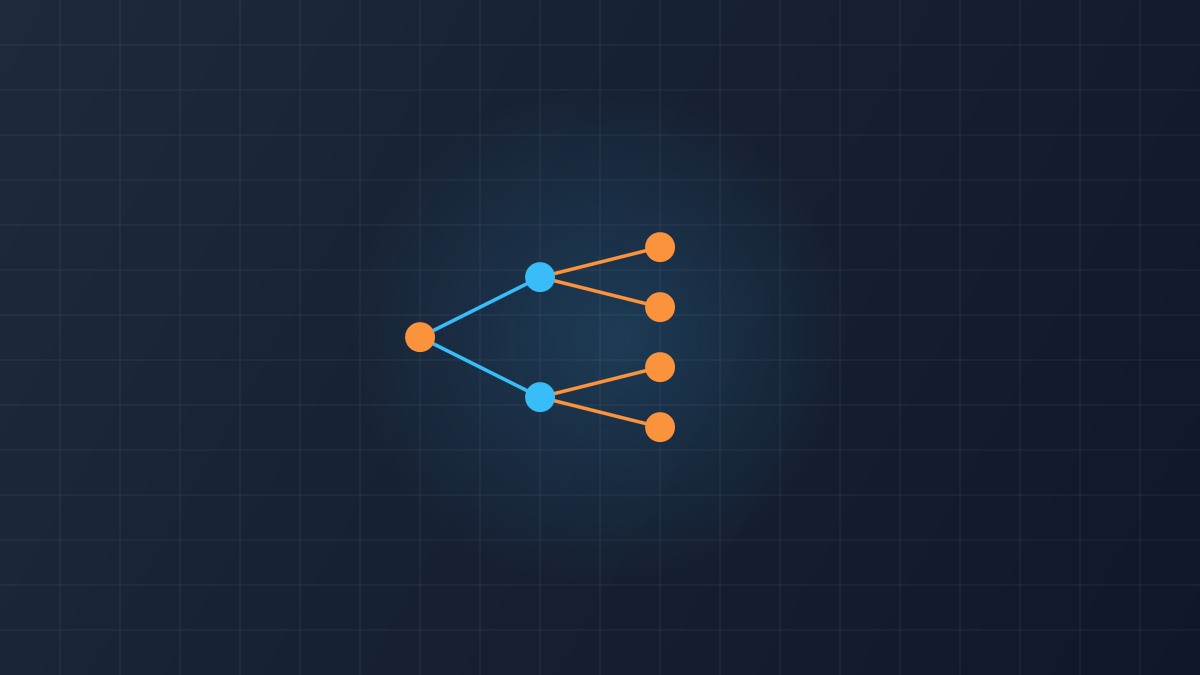
Branching tree diagrams and probability decision mazes transform abstract chance into a tangible physical territory. By tracing pathways where every fork in the road represents an independent probabilistic event, students visually map complete sample spaces, calculate compound probabilities, and discover the foundational logic of modern predictive science.
1. The Tree Diagram: Visualizing Every Possible Universe
Consider the classic problem: "If you flip a fair coin three times, what is the probability of getting exactly two heads?" An untrained student often guesses $\frac{1}{2}$ or $\frac{2}{3}$. A tree diagram eliminates confusion by systematically laying out every possible outcome:
- Flip 1 (The Trunk): Splits into 2 branches → Heads (H) or Tails (T).
- Flip 2 (The Limbs): Each of the 2 branches splits again into 2 → HH, HT, TH, TT (4 outcomes).
- Flip 3 (The Twigs): Each branch splits into 2 → HHH, HHT, HTH, HTT, THH, THT, TTH, TTT (8 total outcomes).
By visually scanning the eight terminal twigs of the tree, students easily identify the three branches containing exactly two heads (HHT, HTH, THH), arriving at the exact mathematical answer $\frac{3}{8}$ ($37.5\%$) with absolute visual certainty.
2. Branching Probability Mazes: Navigating Weighted Pathways
Probability mazes take tree diagrams and turn them into an immersive game. Students navigate an adventurer through a subterranean dungeon or outer-space labyrinth where each junction requires rolling a die or spinning a spinner to determine which corridor to take:
- Even Split Junctions: Corridors split into two paths with equal $\frac{1}{2}$ odds based on a coin flip.
- Weighted Asymmetrical Junctions: One wide corridor represents rolling a 1 through 4 on a standard die ($\frac{4}{6} = \frac{2}{3}$ probability), while a narrow secret door requires rolling a 5 or 6 ($\frac{2}{6} = \frac{1}{3}$ probability).
- Compound Path Multiplication: To determine the overall probability of reaching a legendary treasure room at the end of three consecutive corridors, students multiply the fractional odds along their path ($\frac{1}{2} \times \frac{2}{3} \times \frac{1}{4} = \frac{2}{24} = \frac{1}{12}$).
"Probability is not about predicting the future with absolute certainty; it is the art of calculating the exact contours of our uncertainty."
3. Combinatorics: The Exponential Explosion of Possibilities
Branching maze puzzles also provide an unforgettable physical demonstration of combinatorics and permutations. When students design a "Create-Your-Own-Sundae" branching maze—choosing between 3 ice cream flavors, 4 syrups, and 5 toppings—they physically draw $3 \times 4 \times 5 = 60$ distinct terminal bowls.
This hands-on exercise dramatically illustrates the Fundamental Counting Principle. Students understand why password security requires multiple character types: every added variable multiplies the total branching maze of possibilities exponentially!
4. Four High-Impact Classroom Probability Labs
- The Coin-Flip Plinko Board: Build a simple vertical pegboard where marbles drop through 6 rows of offset pins, bouncing left or right with 50/50 odds at each pin. Students watch the marbles accumulate at the bottom into a perfect Bell Curve (Normal Distribution).
- The Monty Hall Dilemma Simulation: Recreate the famous game show puzzle with three paper cups and a hidden prize. Students run 30 trials sticking with their initial choice versus 30 trials switching doors, empirically proving why switching doubles their winning odds to $\frac{2}{3}$.
- Genetics Punnett Square Mazes: Cross-curricular biology integration! Students use 2x2 probability grids to predict dominant and recessive genetic traits in pea plants or mythical dragons.
- Board Game Fairness Audit: Have students roll two 6-sided dice 100 times, graphing the sum. They discover why 7 appears six times more often than 2 or 12, explaining the core economic strategy behind games like Catan and Monopoly.
Explore our free printable Probability Tree Mazes & Combinatorics Worksheets on PuzzleNest to turn abstract chance into concrete mathematical insight today!